
Tables come in many shapes and formats. Although there are many programs in which you can create tables, InDesign allows the designer to be in control of all the elements in a table. For this task, I was challenged to create an effective layout that utilised a table. Since I’ve never worked with tables before, this task was quite tricky at first. After countless trial and error attempts, I feel like I got the gist of the essential features.
Design ideas and design process
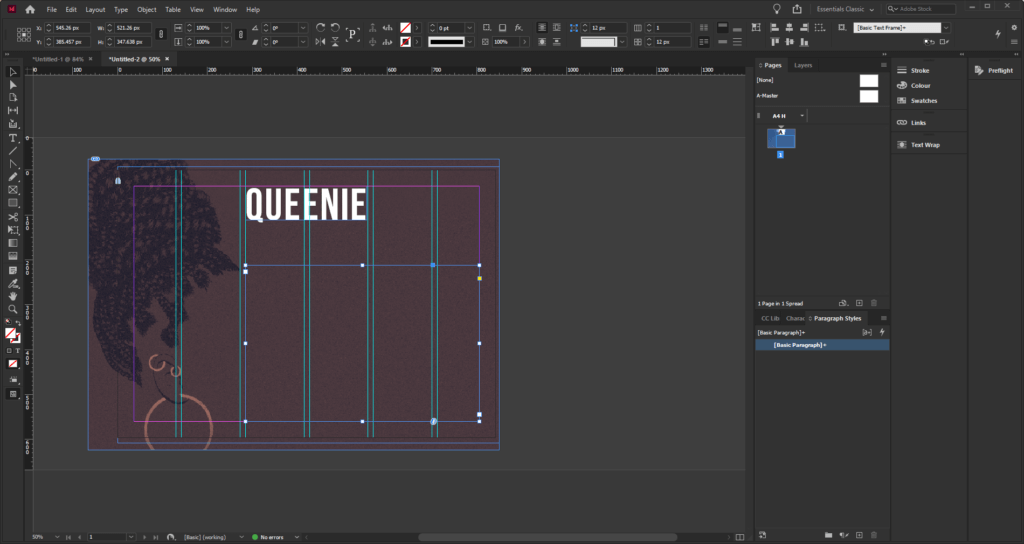
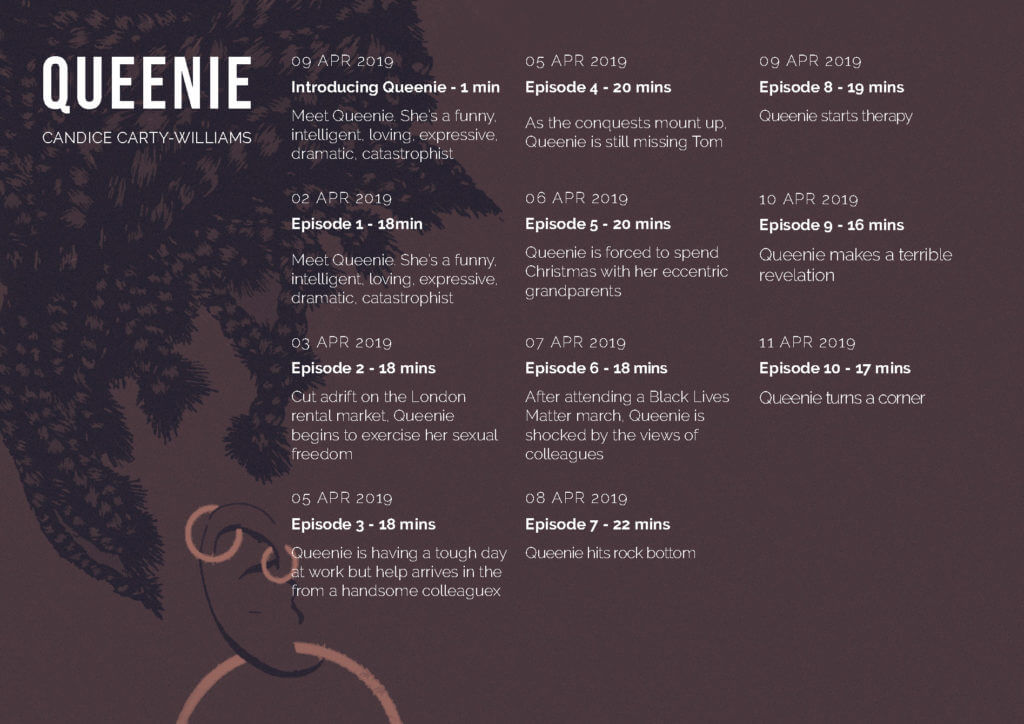
To start this task, I first imported images I wanted to use in my design. I decided to use the existing book covers and adapted them by changing the colours and removing the text to leave a clean image. I then pasted the photos into the file and arranged them on the page. I locked the image in-place to ensure that it does not get in the way while I work on the table.
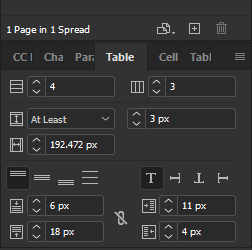
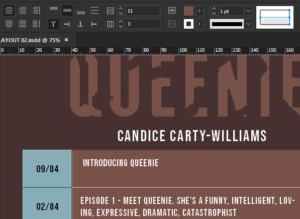
To set up my table, I first created a simple ‘grid’ to help me position the title and the rest of the text (Figure 01). I placed a text box inside the grid I created and used the table tool to create a 12 cell table (Figure 02). Using what I learnt through my research, I started customising the table. This process was mainly based on trial and error since I did not know what to do. Having said this, however, I eventually managed to achieve the look I wanted to.
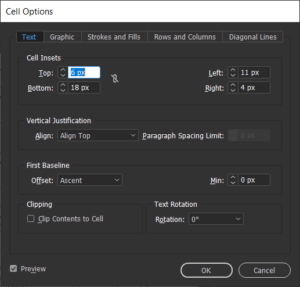
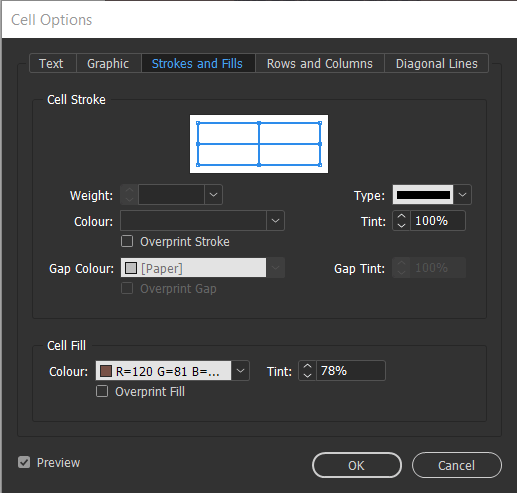
For the cell style options, I changed the cell inset sizes to make sure that the table does not appear crowded, and the information is easy to read (Figures 03). The use of space in this example is vital as I have not intended to use any rules between the columns and the rows. I created this effect by adjusting the ‘stroke and fills’ settings found in the cell options (Figure 04). To remove all lines I selected both vertical and horizontal strokes and set their colour to ‘none’. Figuring out how to use this feature was quite tricky, but as I worked my way seeing what works and what doesn’t, I eventually got the gist of it.
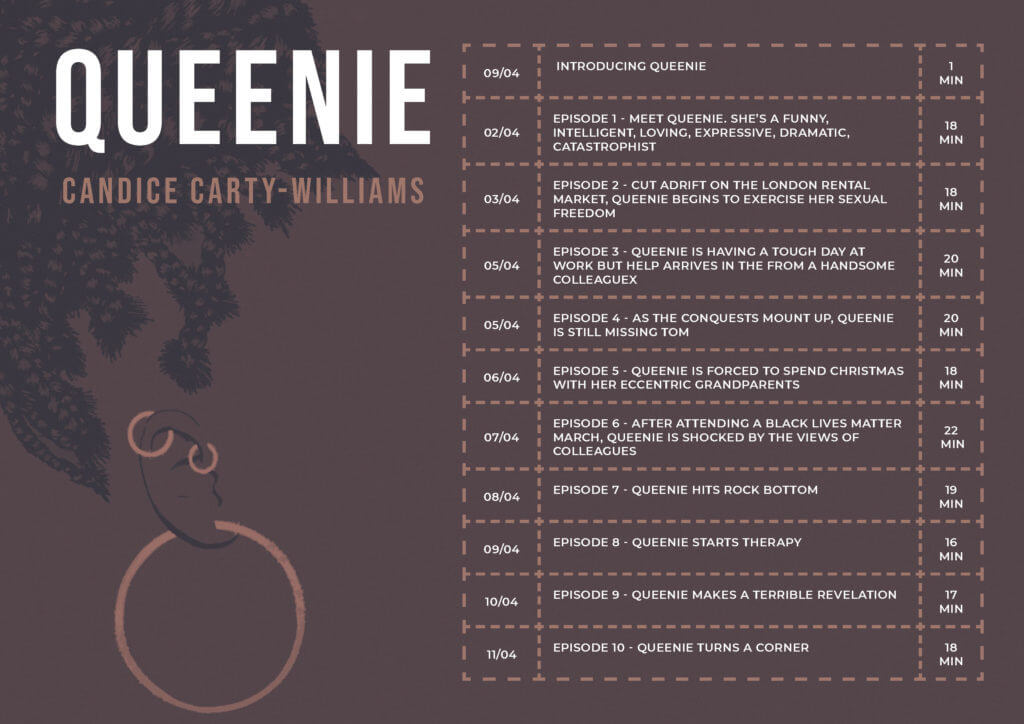
After I was happy with the table I created for this design, I started to format the text. I decided to put the dates at the top as this seems like one of the most crucial information to the intended user. For the dates, I chose to use the all-caps type because I wanted the information to be easier to find and comprehend. Furthermore, I simplified the dates so that they are easy to understand within seconds but also to save space. For the descriptions, I used the regular font since this information is the least important.
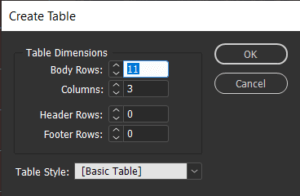
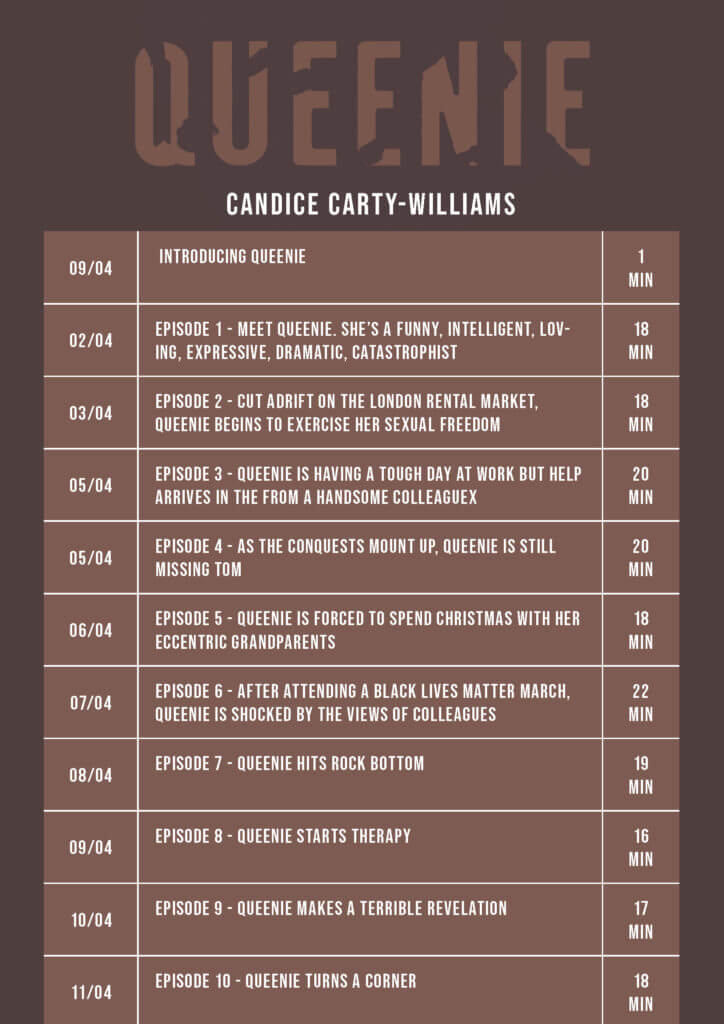
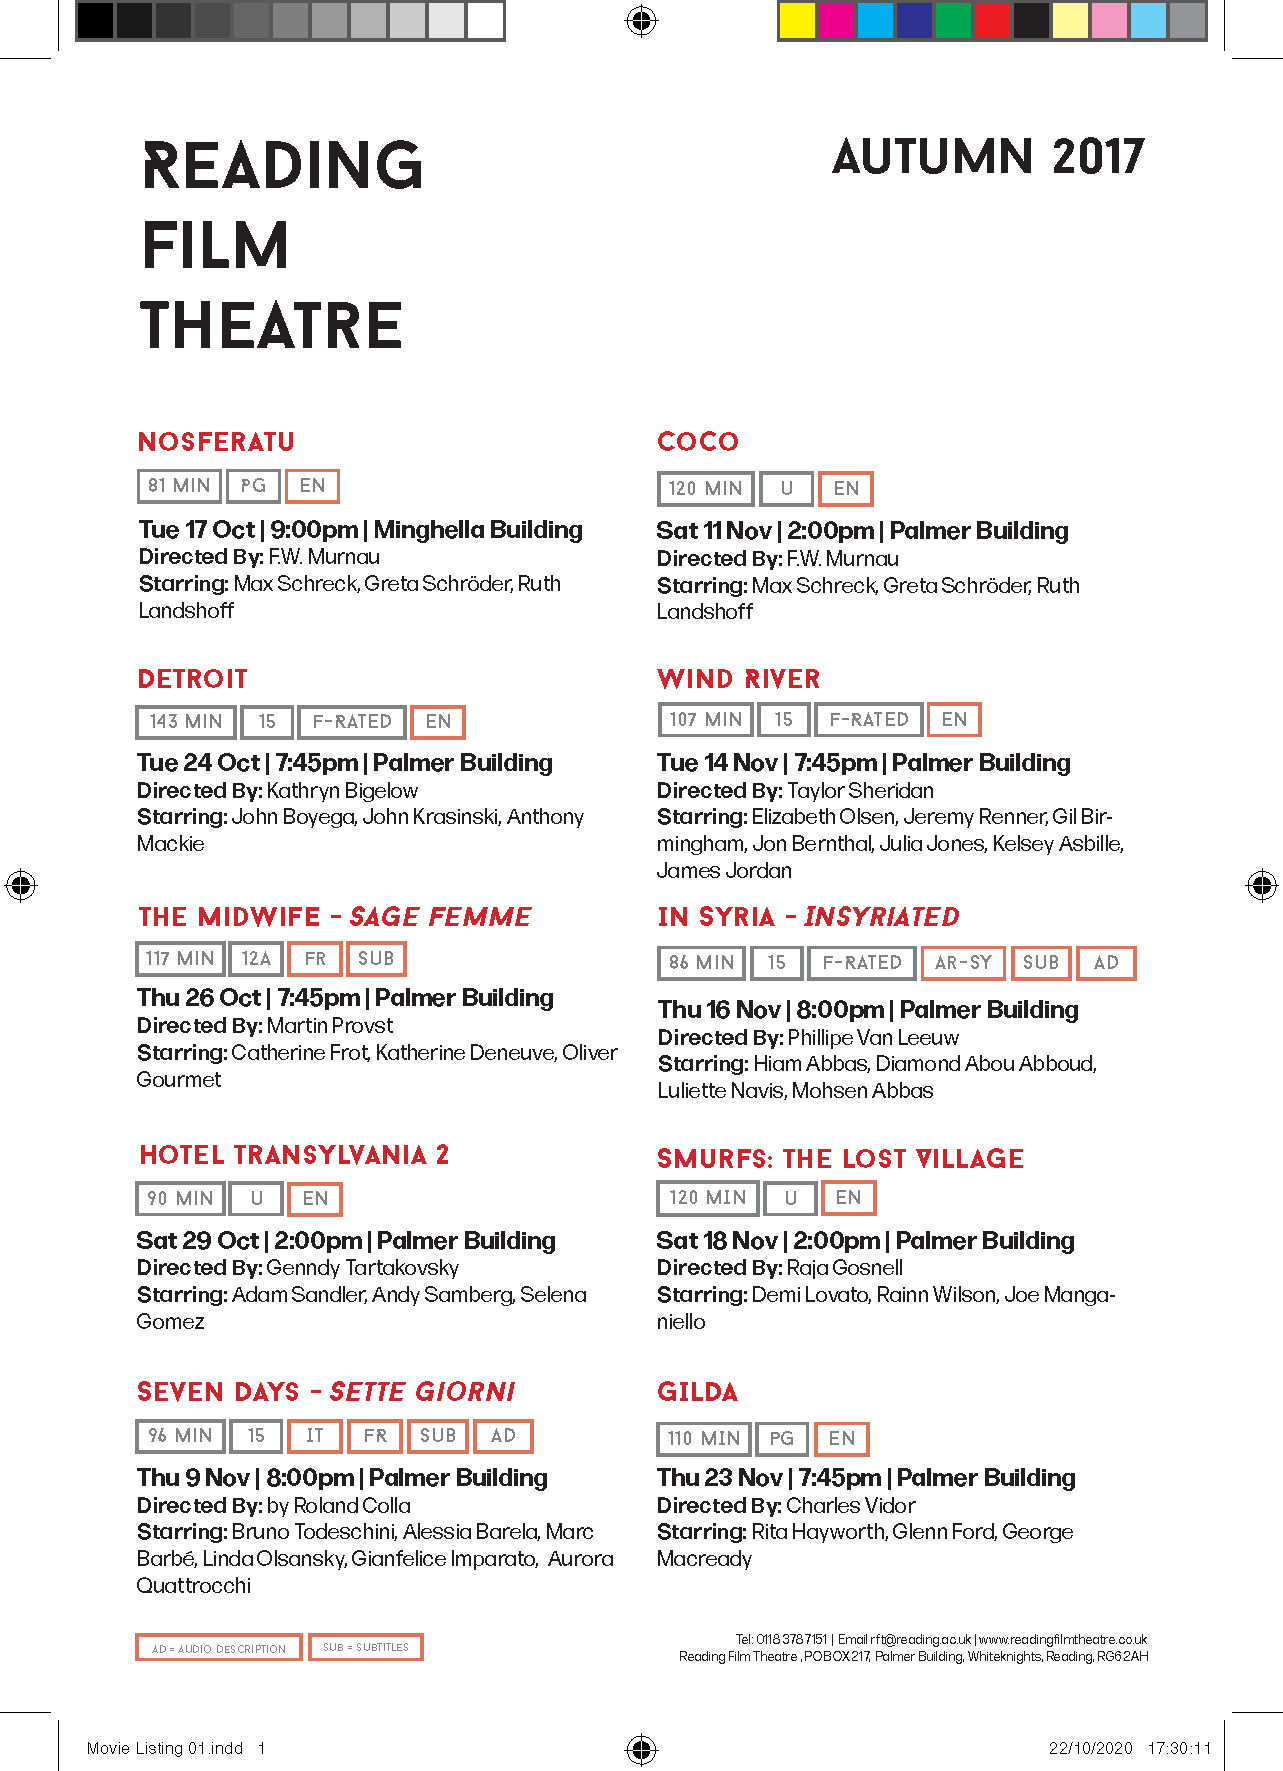
For my second design idea, I wanted to experiment with the table in a different format – portrait. While working on this idea I tried to focus more on arranging information, rather than focusing on the visual aspect of the design. I first made a text box and followed the same steps as my previous design. By choosing a portrait format, I realised that I could utilise more space and make the information more readable. Unlike in my previous design idea, I did not have to worry about maths and try to work out how many columns and rows I need. Instead, I created eleven rows an three columns: first for the date, second for the general information and third for the duration of the podcast (Figure 05).
Since the cells in this design were much narrower than in my previous design idea, I decided to add strokes to make sure that the information is not mixed up. After experimenting with the table and cell styles, I learnt how to use cell styles to recreate this effect. Using a feature found in the top bar menu, I could select the individual column and row strokes and change their weight as well as style (Figure 06).
To use this feature, I picked the columns I wanted to format. In this example, I highlighted the first column and highlighted the strokes I’d like to format. Once I chose all the elements to edit, I changed the colour/weight and saved the formatting in a new cell style. I repeated this step for the rest of the rows until I was happy with the result.
In my final design idea, I decided to combine the two styles into one. Both designs were equally good; however, I noticed that each had flaws In them. By picking out the favourite elements from each design, I managed to create a table that is legible but also visually appealing. Since this is a form of advertisement, It was important to me that the designs I created were eye-catching; this was not the case with my second design idea with lacked ‘decoration’.
Software tutorials
The tutorials I found on the brief were pretty useful since I lacked even the most basic knowledge of tables. The tutorials, however, were a bit too basic and I wanted to challenge myself during this task. Over some time I allowed myself for this task I watched several videos on Linkedin learning. These were very useful as they not only explained the basics of using tables but also had an in-depth demonstration of the other tools. Since I am only used to working with text; therefore, the character and paragraph styles, I was surprised that tables have styles as well. I was quite happy to realise that they work in a very similar way. What I learnt through Linkedin Learning was very useful, as it allowed me to style every single element of my table. This is unusual to me because I am used to creating tables on PowerPoint or Excell, where the styling of the tables is limited.
On the other hand, a lot of the tutorials I watched were quite outdated. For example, one of the videos dated back to 2015. Adobe updates its programs on regular basis, meaning some of the features in the version of the program I’m using, were not discussed in the tutorials. Because of this, I’d like to further explore new features related to making, styling and formatting tables. Often, the features introduced by Adobe have a goal of speeding up the designing process. Working under pressure is something that I struggle with; therefore, it would be useful to know some tool that could speed up my design process.
Resources for research and inspiration
Because many of the videos watched as part of my research were fairly old, I found them quite uninspiring in terms of what I can achieve using InDesign. Having said this, I looked at examples of modern tables and noted some key features that are not seen in older table designs. One notable key feature is the use (or lack of it) of horizontal and vertical strokes. It was quite common for me to come across works, in which the stroke seems to be the major contributor to the overall design of the table. Another notable feature was the use of colour in these tables. The main purpose of the stroke is to identify between the different columns and rows in a table. Although they are functional, often they are styled in a specific way: e.g. light, dark, dashed or dotted. In my last design idea, I experimented with the different stroke types. After trialling the different styles, I concluded that I liked the look of the dashed line. At first, I struggled to recreate this idea, because of my basic knowledge of this feature. Eventually, I became much more confident and my experimentation leads me to create this effect.
I also researched the book itself. Although this was unnecessary I didn’t know anything about the book; therefore, I felt quite uninspired. The only images I could find are that of the book cover. By analysing the branding features on the book cover, I figured out what style I’d like to use for this design. Learning what the book is about has also influenced my design decisions – at first, I found it difficult to think of any ideas; however, after reading reviews of the book it was easier for me to decide what I’d like the design to look like.
 Although the feedback I received was mostly positive, I introduced some changes in terms of space:
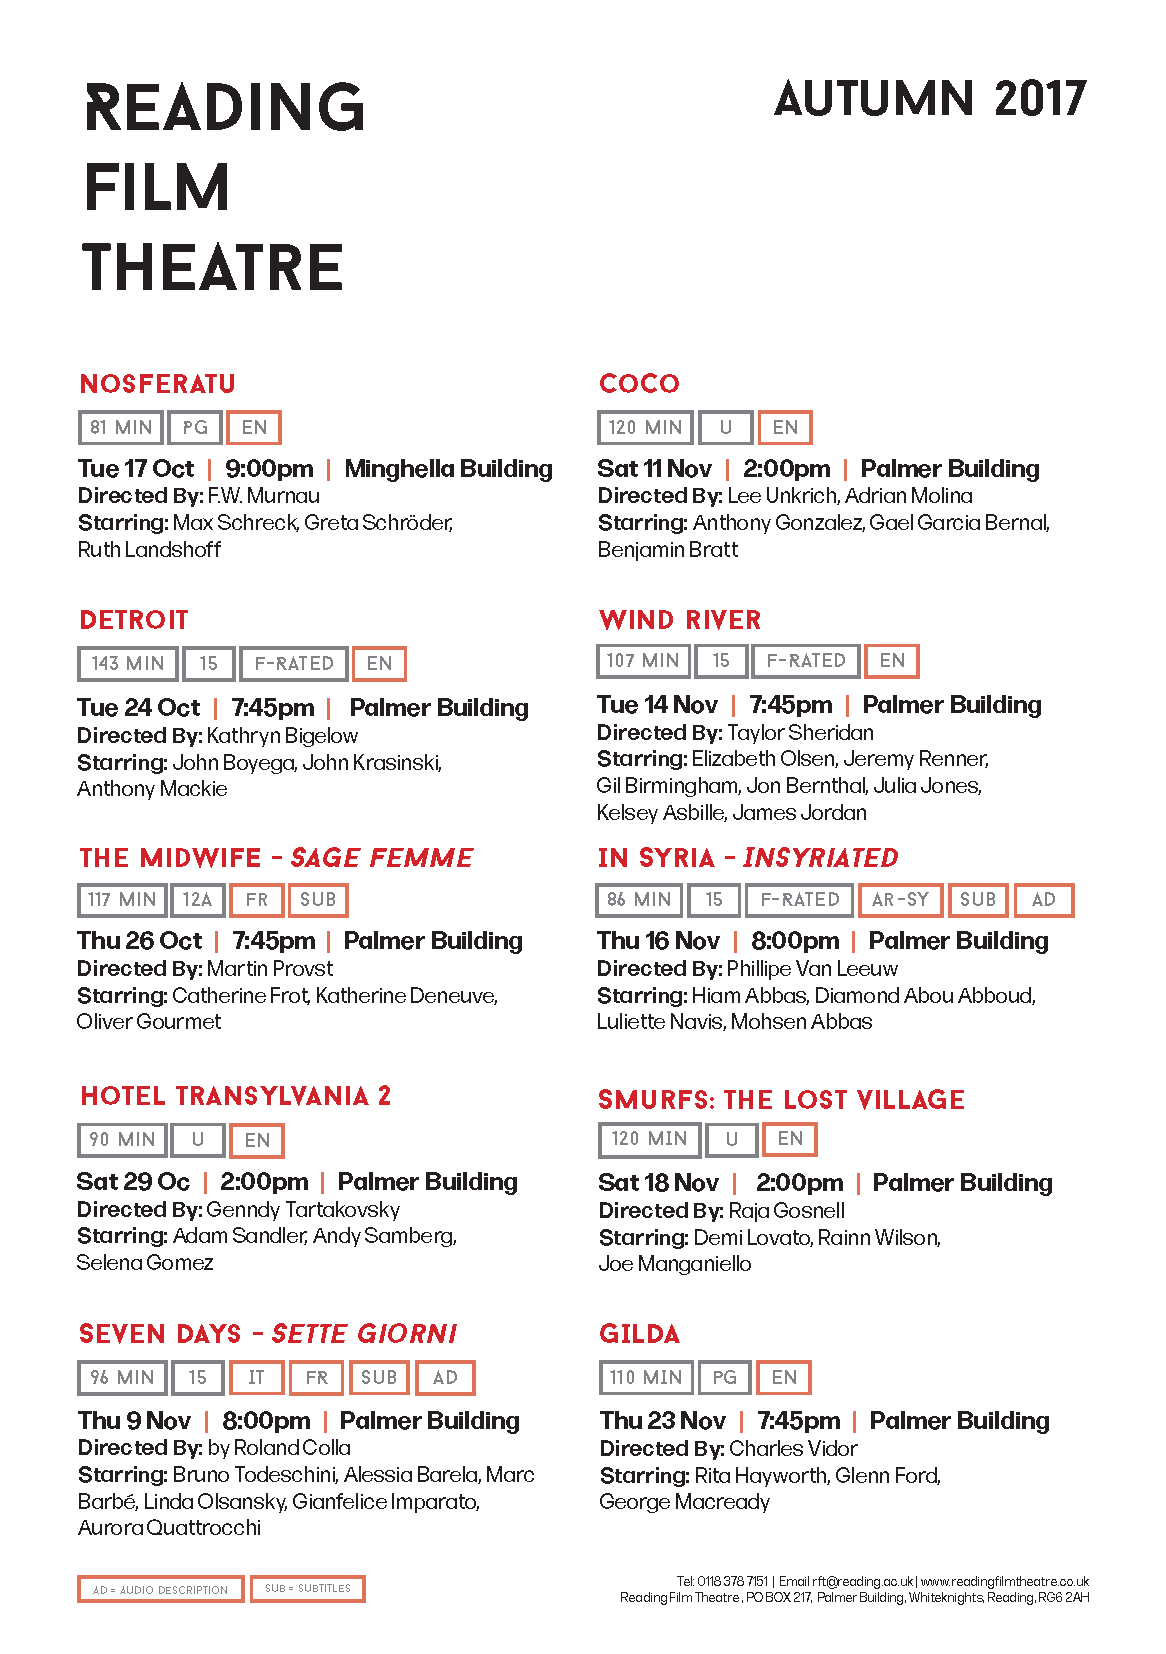
 Sue and Emma’s project was all about gathering real-life examples of COVID images around us. Since it’s been months since the first Corona outbreak, it’s fair to say that we all got used to the repetitive posters and announcements that routinely remind us about the laws put in place to stop the spread of coronavirus in the UK. Having said this, a lot of us stopped paying attention to the posters themselves. I highly valued this experience as it’s not often that I look or analyse real-life examples of information design. It has taught me a lot about features found in Covid imagery, from the choice of colour to the specific fonts and typefaces.
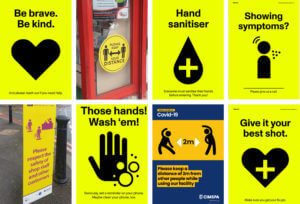 of the posters were also accompanied by icons and vector images that illustrated what was stated on the posters.
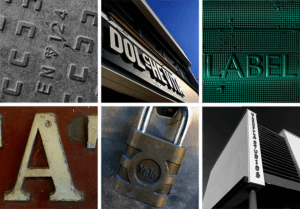 While outside I focused on finding hidden type, one that wasn’t visible straight away, or its features weren’t as obvious from the distance, as opposed to up close. I also tried photographing these examples of type from different angles, especially if it was raised, to see whether that affected how we see it. After we have taken the photos in the given amount of time, we were asked to produce visual collages based on the common similarities between the typography we have taken photographs of.
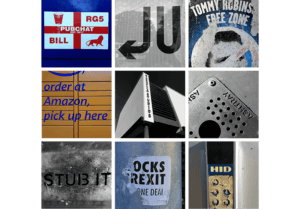 Beforehand, I edited any images I wished to use in this mini project via Adobe Photoshop, which allowed me to emphasise some of the features, and make sure that all images within the collage look visually similar to one another. In some cases, I have also straightened up the photographs, making sure that they have some logical perspective, and are overall pleasing to look at.
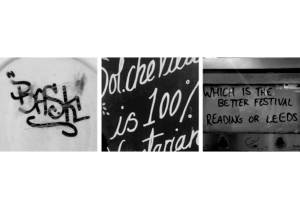
 As mentioned previously, the aim of this task was to create a monogram – a combination of two letters, using either Garmond or Futura typefaces. I personally chose Futura, as I am more attracted to the ‘orderly’ aspect of sans-serif typefaces. Initially, I started sketching out some ideas on my iPad, however, I then decided to go back a step and start designing on paper. Personally, I found this a lot more helpful as I noticed that I was generating more ideas while working on physical paper. After generating some sketches in pen etc, I then decided to go back to working digitally. As we were designing monograms (logos for our initials essentially) I decided to use Adobe Illustrator for this task. I first began recreating some of the sketches I have done previously to see what works best alongside the Futura typeface. The first ideas were quite simple and straightforward, a either one or both letters were upright and looked like two letters put together (literally). It wasn’t until I started looking at more abstract versions of my monogram, I began designing monograms that
  had some interest to them. The 2nd photograph on this page presents the design development process based on one of the more abstract ideas I have created previously. First I started by rearranging the orientation of these letters, seeing what works and what doesn’t, and then once I was satisfied with the result, I began rotating the monogram in order to see if it looks different/more effective when looked at from a different perspective. My hypothesis was quite right, presenting the monogram at a slight angle made it look more stylised, almost lik
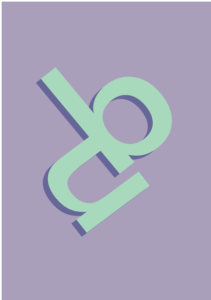 e a logo.
 Creating impactful images with Sara was probably one of my favourite activities so far. Creating work with deeper meaning has always been something I felt passionate about, and the activity allowed me to practice my illustration skills. As part of the brief, I was asked to create two images based on the theme of religion. Based on my own knowledge, I was aware of the current issues in China regarding the Uighurs, an ethnic minority found mostly in east Asia. the idea was based on a photograph I saw of Uighur protests, I have used it as a reference for my idea. I decided to produce my ideas using Procreate and Illustrator, as these are two illustrating software I’m most familiar with.