
Introduction
I think it’s important to start off by saying I had no idea how to make tables and grids in InDesign. Other than my limited use in the book design project and making work files, I haven’t used the software before. I was well aware that I’d have to start with the basics, but I’m glad this module gave me a chance to do this.
Software Tutorials
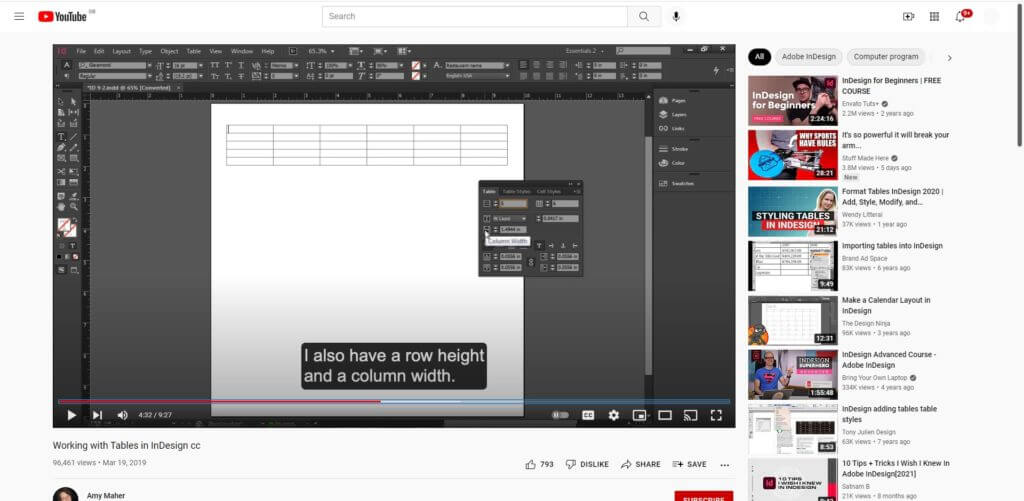
I, therefore, had to begin with the software tutorials, needing this information to progress with this challenge. I began with a YouTube tutorial by Amy Maher, which allowed me to grasp the basic technical aspects involved in grids and tables. This focussed on the foundational skills, a complete beginner’s guide to this tool which was perfect as I currently didn’t know anything about this.
Using my newly-gained knowledge, I opened InDesign to begin this project. I decided quickly that my first design would be an incredibly basic but functional table, making sure that I could adapt this to suit my needs, before moving on to a better designed and more visually appealing design.
Design Ideas and Process 1
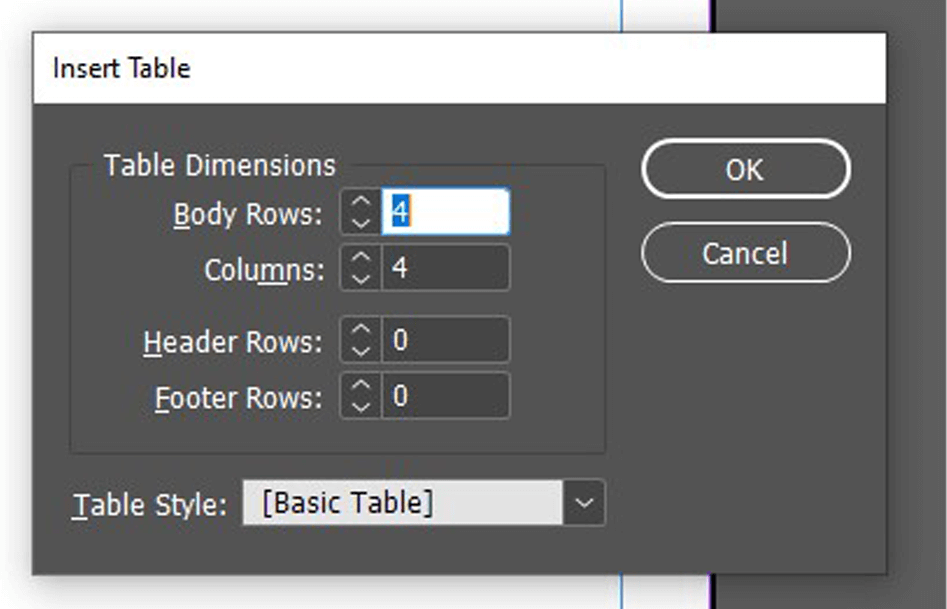
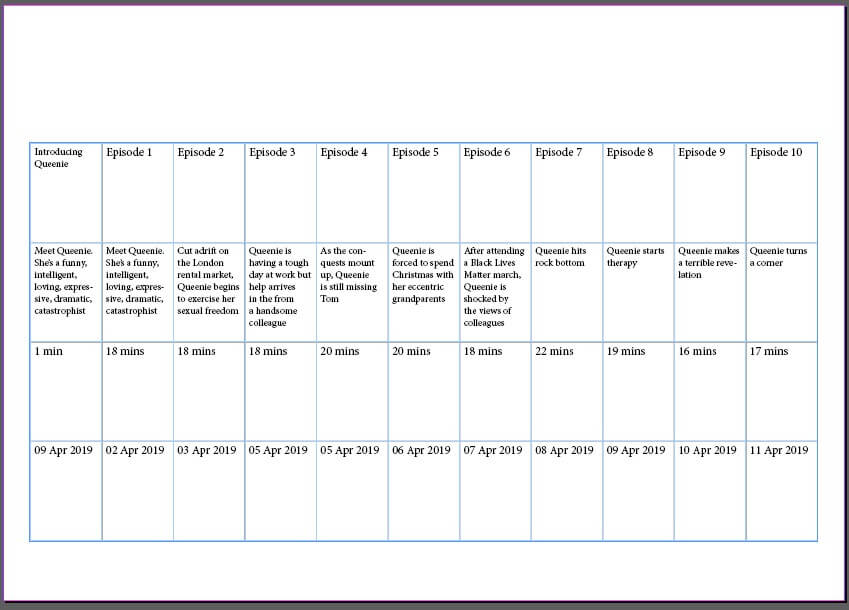
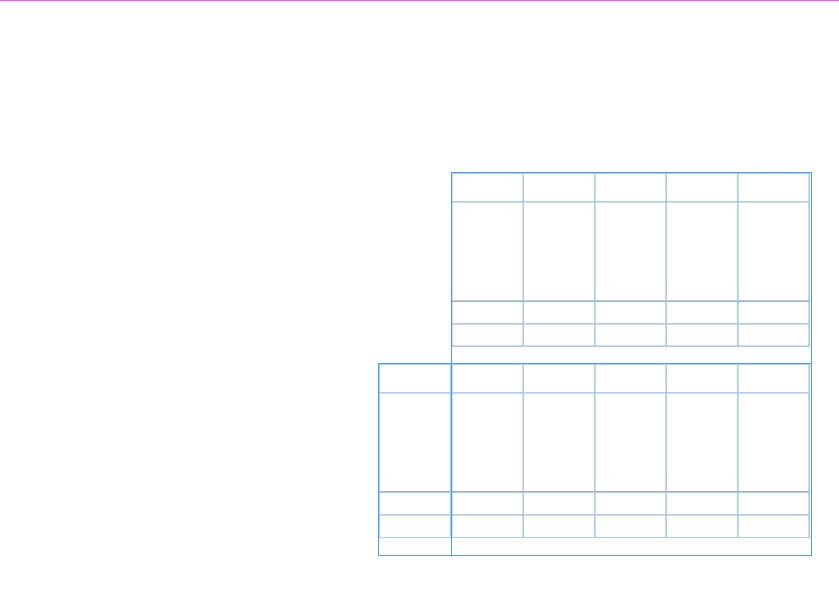
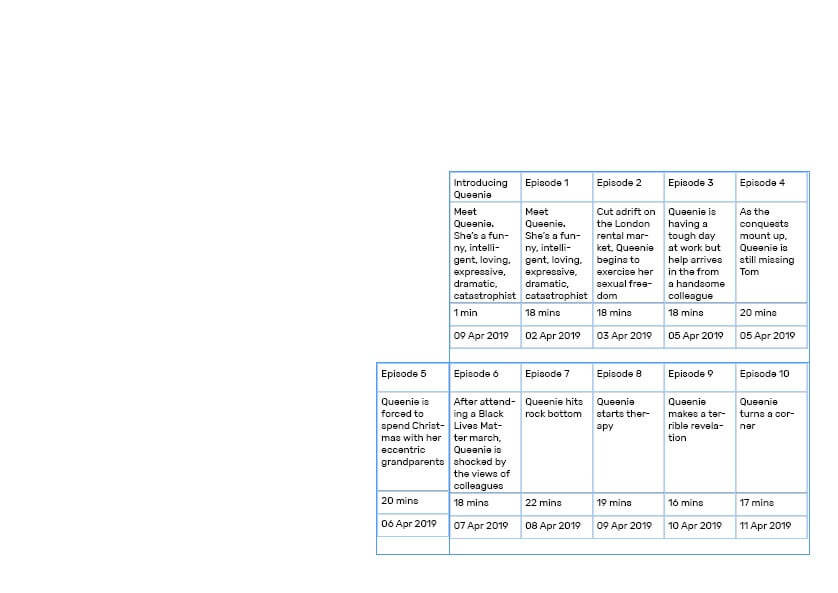
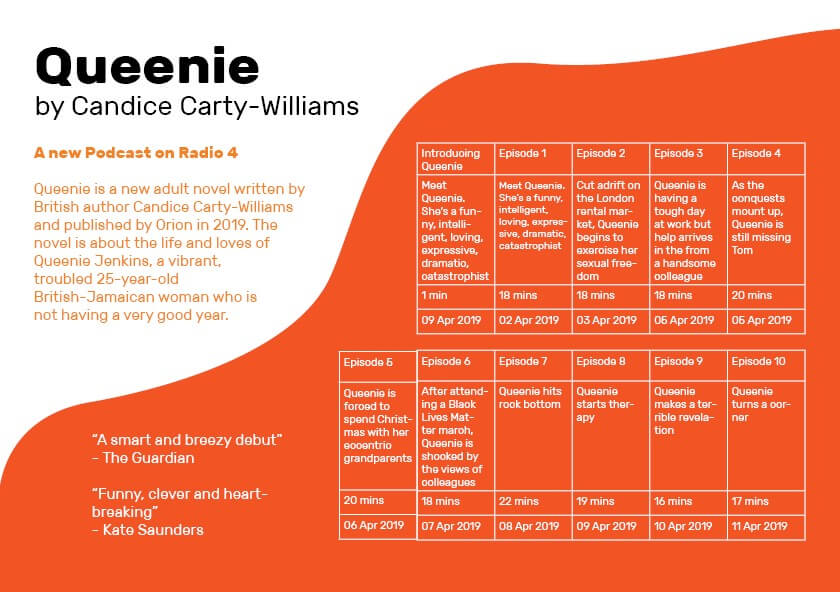
I started by closely following the tutorial – I used the ‘Create Table’ tool to add a table to my page I was then able to specify the specifics, altering the rows and columns to my requirements. I did a simple, linear format for these, not wanting to overcomplicate the design. This tool worked well (other than me needing to add an extra row to the top for the titles), allowing me to input the data into each cell.
As the tutorial said, I was then able to adjust the size of my cells, selecting a row or column to adjust a group at the same time, a quicker and more consistent method. Having done this, my simple table was complete and I was able to move on to the design aspect.
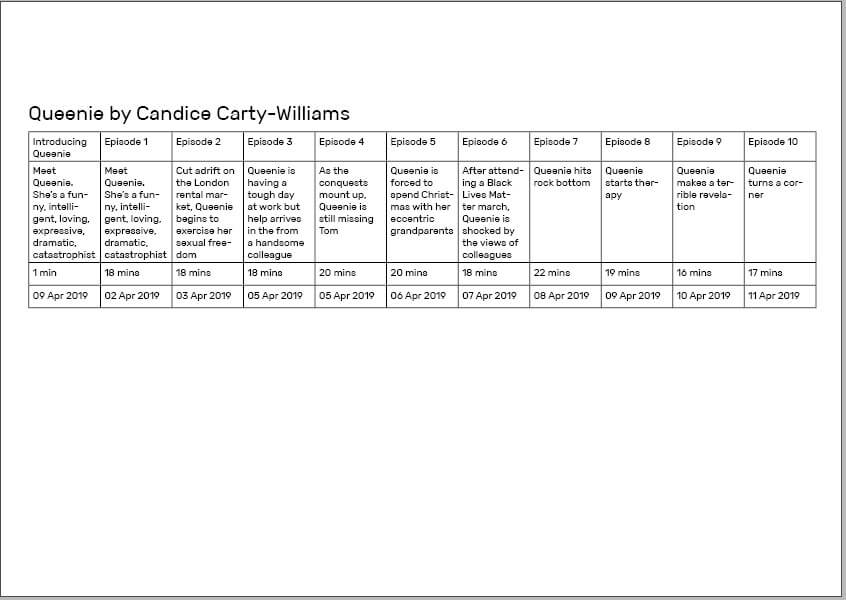
I placed this table along the bottom of the page, adding text initially to create a clear hierarchy. I used knowledge from the previous terms InDesign class to allocate clear paragraph and character styles, while also knowing more about the alignment and structuring that would benefit my final design.
Finally, I added an image of the book and quotations along the right-hand side, allowing a more balanced design to be achieved and having typography and layout separating the different layers of information.
I am happy with this design, clearly a simple beginning, but allowing me to test this tool for the first time and gain more experience in InDesign, both technically with the software and enhancing my skills as a designer through more practice.
Software Tutorial/Article
Coming off the back of that example, I wanted to explore the styling aspect of the table more, breaking the conventional, linear structure. I began looking at articles and resources, finding a post by ScienceEditor about the best practices for table design. This added to the foundational knowledge, informing me of conventions of table design – these included the increased ease of comparing numbers when in columns rather than rows and the benefits of breaking up a long, linear table.
I also had to consult an article when hitting a problem – when having trouble adding a row into the table, I used a blog by Adobe to fix this minor issue.
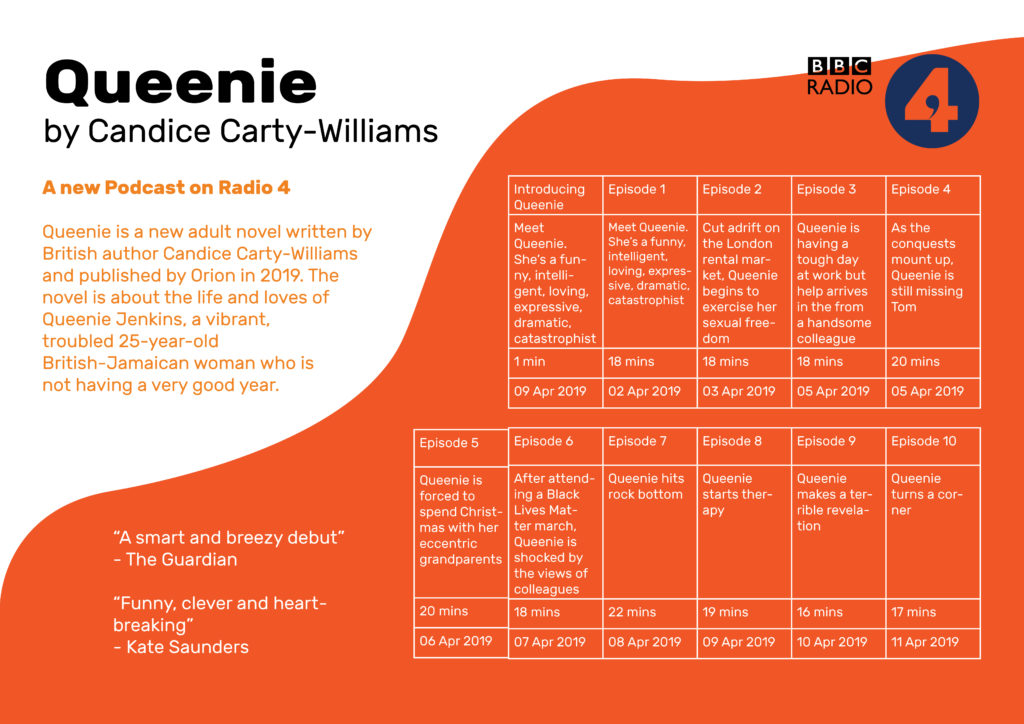
Design Ideas and Process 2
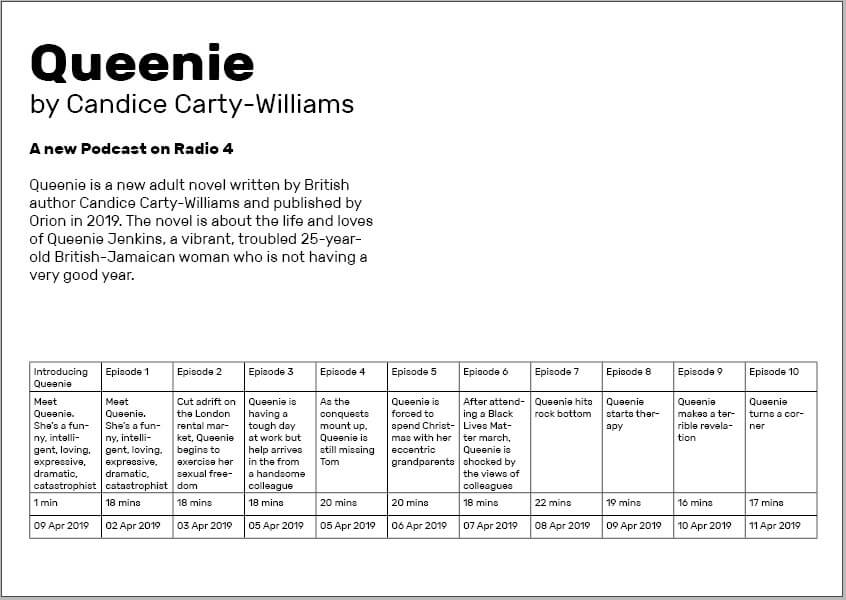
I began by creating a more visually interesting layout for the table, stacking the two parts on top of one another and right aligning it. I then filled in the same data, ensuring that each entry has a consistent size to the next.
I was much happier with this structure for the information; although not linear, the information is still clear and creates much more interest through this less conventional shaping.
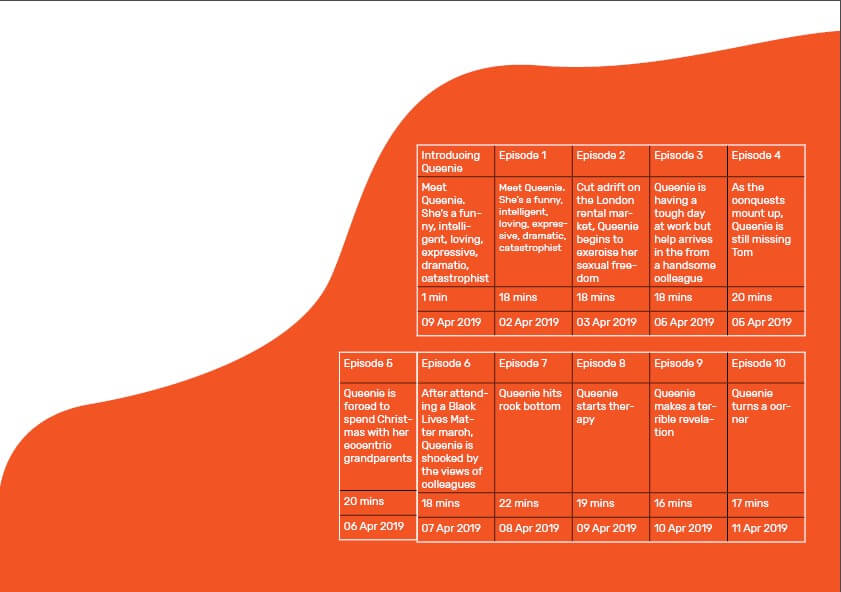
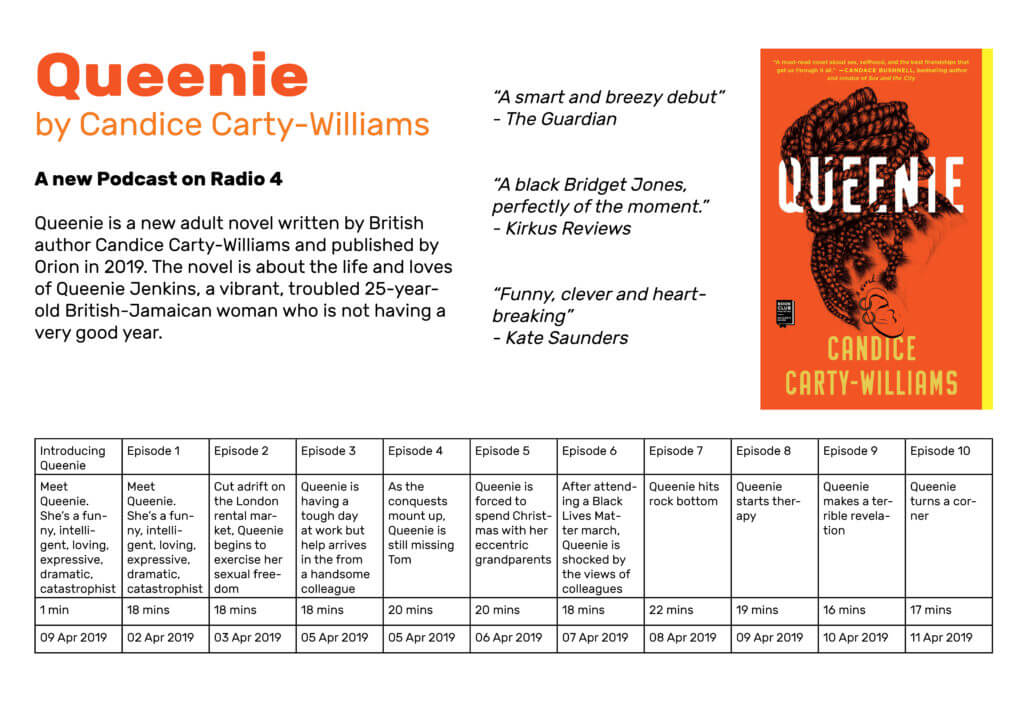
I added this coloured shape as a background element using the pen tool, looking to make something fluid-like but not overpowering. I used the colour picker to select an orange from the book cover. Looking at this with a black table, I knew I had to invert this to white, the contrast making the table and its data more readable.
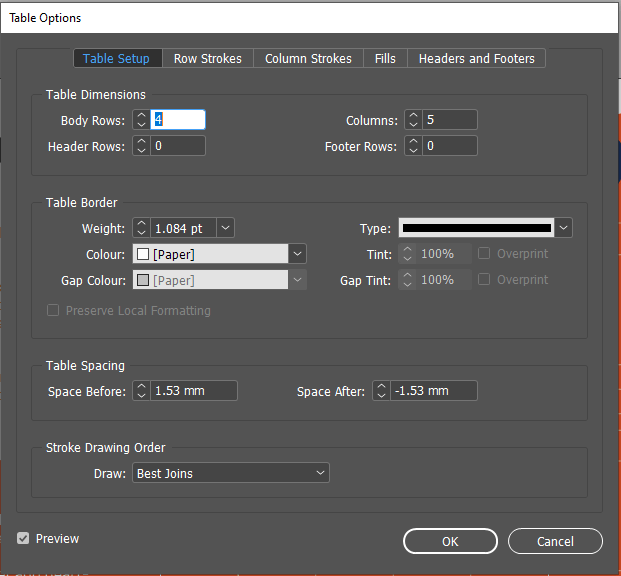
However, this was not as easy as I thought – I had to use the ‘Table Options’ menu to adjust the colouring, also allowing me to alter the line weight. The results of this were much more successful, with a clearer contrast helping the table stand out from the background.
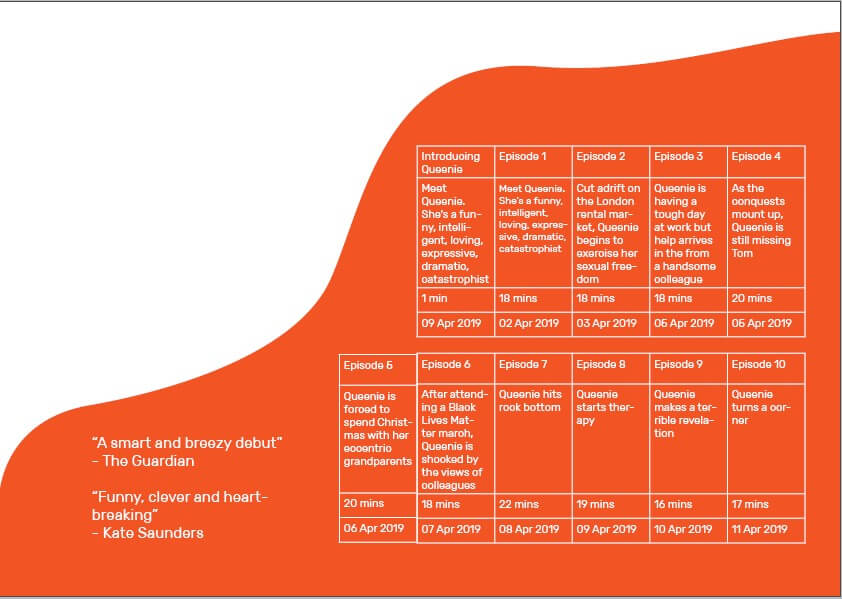
Now being happy with the layout and colouring of the table, I moved on to the rest of the design. I began by adding two quotes into the remaining orange space, testing all three and deeming this too much.
I then went on to add the text (sources from the book’s summary) and the title to the top, again using size, font-weight, and spacing to create a structure and deliberate relationship between the levels of information.
Design Resources
Finally, I added the BBC Radio 4 logo (an online resource) to the design, feeling this provided some visual balance to the design and helped to complete the layout. However, the rest of this design was simple typographic work and shapes created by me, not wanting to overcomplicate the design with external images and resources.
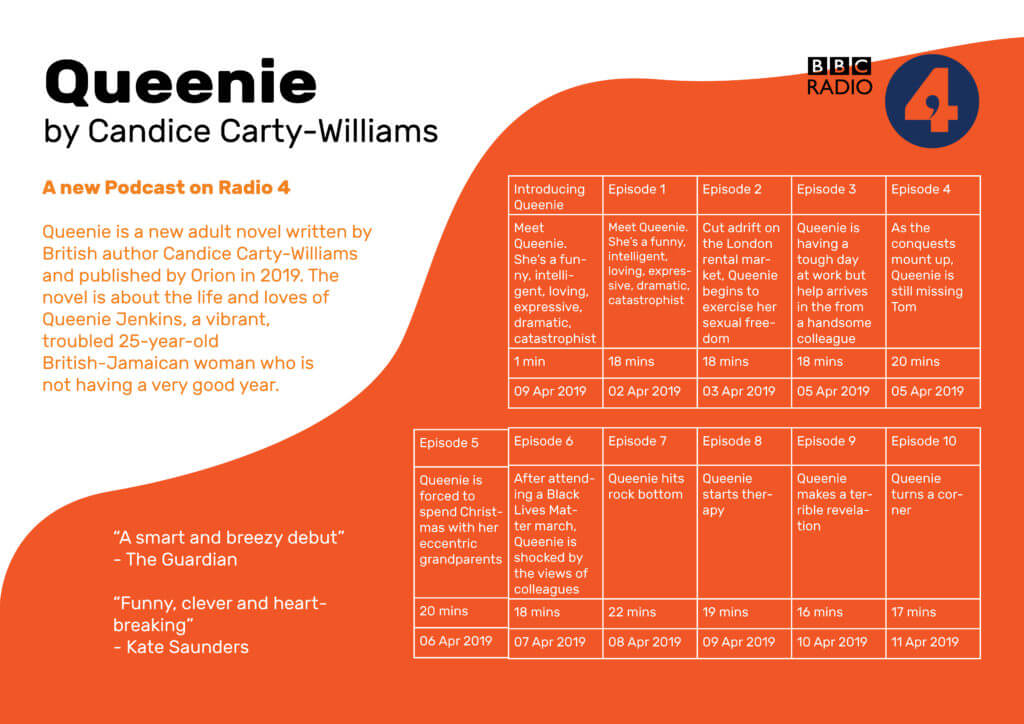
This second design is a better design – visually, the page is much more striking and provides much more interest to a viewer and potential listener. The table itself is much more fun and unconventional layout that helps to draw the eye to this vital information without it dominating the page in size.
Learning Across the Module
I began this project with no knowledge of using grids and tables in InDesign. Although my first attempt was relatively basic (and not without issues), my second design is a visually engaging and effective table, working as an element within a successful and balanced full page. While I am sure there are more nuances to this process, I feel comfortable in creating a table, a skill that will certainly be necessary for later work. I have built up from nothing and am now able to use a brand new tool in InDesign, an integral piece of software I will likely use for the rest of my career.