
Background
The Soil Science project was a university-lead project which required several flow charts and tables in order to explain information and educate individuals about soil science. The diagram designed in this Real Job worked alongside various other diagrams and were given to the audience as a handbook for a conference. The client I was working with on this Real Job was Alison Black, a research professor at the University of Reading, in the Department of Typography & Graphic Communication.
Restated brief
The Real Job had a very quick turn-around time, of just over a week. Because of this, my supervisor decided it was not an effective use of time to create restated briefs to present to the client, and so this stage was ruled out of the project process.
Deliverable
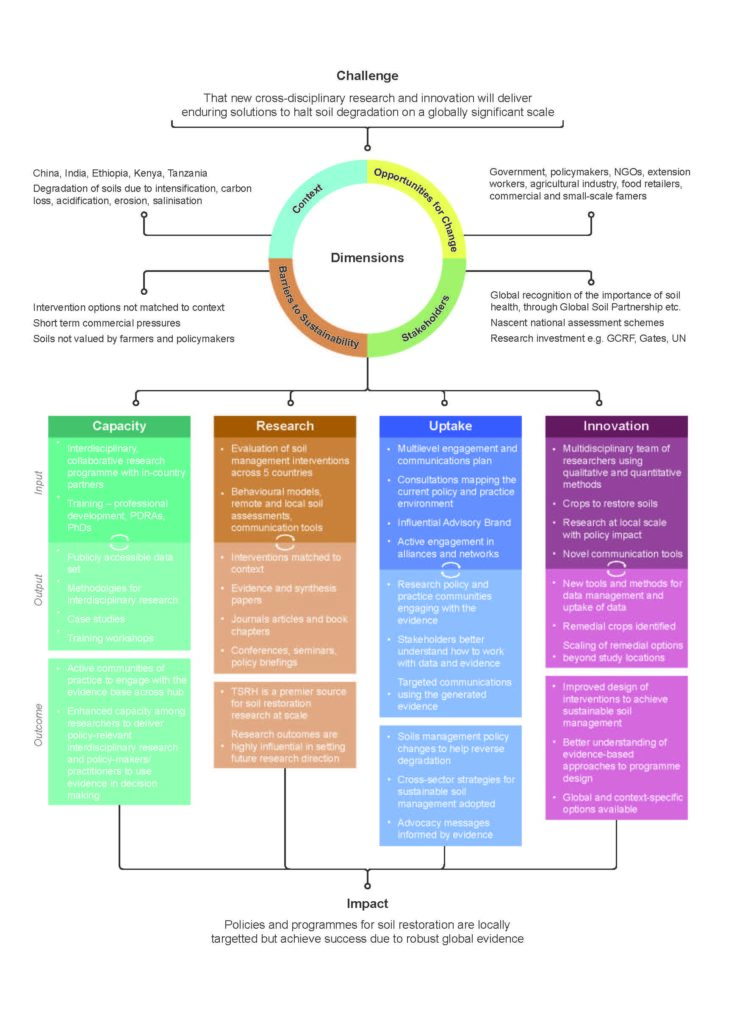
The deliverable in this Real Job was a diagram handing a group of information about soil science. The client requested that all text was given in 12pt regular Arial, and that the diagram was able to print on one side of an A4 page, ideally filling two thirds of the page.
Research and ideation
The client was able to provide me with the existing diagram which needed to be redesigned in order to allow the readers to access its contents easily, with little confusion. My supervisor had previously redesigned an existing diagram and was able to suggest to me what the client expected. Once given the diagram to redesign I looked into different methods of expressing information. This included tables, flow charts and various other diagrams. Due to the stepped stages of the information in the existing diagram, I decided that producing a flow chart was likely to be the most effective way to style the information.
Design development
Due to the short turn-around of the Real Job, there was not a large amount of development with the design. I met frequently with both the client and my supervisor which meant that development was carried out whilst putting together the initial designs for the diagram. The client was very pleased with the designs that I was able to put forwards and issues were resolved quickly. Due to the diagram being used in a handbook for the conference, it was important that the design could work both in CMYK and in greyscale in the instance that the client needed to print in greyscale. The first design shown to the client is given here.

Outcome
The client and I quickly came to the final design and were able to agree on final touches that needed making. I provided the client with PDF, JPEG, PNG and Ai versions of the file so that they were able to place it in to almost any document that was necessary. The final outcomes, in CMYK and greyscale are shown here.


Reflection
Working in close proximity to both the client and my supervisor gave the Real Job a sense of achievement and it meant that I was able to react immediately to feedback I was given by both parties. The project, however, did not come without its challenges. Unfortunately, my MacBook was stolen during the process of the Real Job, meaning that I was briefly without any means of completing the work for the client. Despite this, I was luckily able to borrow a laptop and accessed my files online, meaning that I was able to quickly and seamlessly resume the job for the client. I personally feel that I was able to handle this situation with maturity and prioritised the completion of the job in order to satisfy my client, which is a largely significant factor in producing a successful piece of design for the client. I received very positive feedback from my client throughout the project, for presenting a quick and effective solution to the problem and remaining keen and enthusiastic about the Real Job despite the challenges I was faced with.